by Fortem Financial August 6, 2025
Summary
After reaching new record highs, stocks fell last week (S&P 500 -2.34%). Breadth was notably negative as equal-weighted averages underperformed cap-weighted averages. The pullback related to growth concerns following a disappointing July non-farm payrolls report and sharp downward revisions to prior months. Advancing sectors were utilities (1.56%) and communication services (0.01%); biggest decliners were materials (-5.40%) and consumer discretionary (-4.54%).
Key Takeaways
- U.S. nonfarm payrolls rose a disappointing 73,000 in July, and there were sharp downward revisions of 258,000 to May/June. (May/June/July job growth was the lowest three-month period in five years.) In light of these results, the probability of a Fed cut in September has increased.
- In his presser, Fed Chair Powell noted several times that the unemployment rate has been steady, yet inflation is above target, implying the Fed is focused on the risk of higher inflation more than the risk of weaker growth.
- Year-over-year readings of inflation (2.3%) and the unemployment rate of 4.2% seem good. However, FOMC participants expected both of these numbers to worsen in the months ahead, with unemployment averaging 4.5% in the fourth quarter and year-over-year inflation rising to 3.0%.
- 2Q GDP flash was 3.0%, but real final sales were up a more paltry 1.2%. (Net trade as a result of tariffs boosted growth by 5.0%).
- So far, the impact of tariffs on overall earnings has been less severe than initially anticipated. The effective tariff rate seems to be shifting from around 10% to around 15%. This remains a manageable number for most corporations.
- While trade deals may give the initial impression of emerging stability, risks remain: Will the details to be negotiated cause some deals to fall apart? Will each (the U.S. and the relevant trading partner) stick with the details? And what economic headwinds (e.g., inventory builds, margin hits) will the deals create?
- With half the S&P 500 having reported 2Q25 earnings, more than 80% have exceeded expected earnings and more than 60% have exceeded expected revenues. The average earnings beat has been about 6%, a strong result.
- July was the third straight month of equity market increases and the first month in a year where no day saw the S&P 500 up or down 1% or more.
- Through July 31, the path of least resistance for stocks has been higher on the resilient macro backdrop, the steady removal of tariff uncertainties, elevated buying by retail and quants, earnings beats, the AI growth theme, expected Fed rate cuts, and a pickup in deal activity.
- While it's not believed that we are in a full-blown bubble, asset prices are at or near all-time highs in many areas. Stocks are priced for perfection and the market's failure to power higher in the face of strong 2Q EPS results leaves us wanting to take some profits over the near-term into weaker seasonality.
Source: Bob Doll, CEO Crossmark Investments
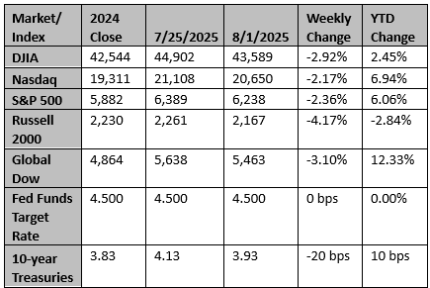
Chart reflects price changes, not total return. Because it does not include dividends or splits, it should not be used to benchmark performance of specific investments. Data provided by Refinitiv.
Sincerely,
Fortem Financial
(760) 206-8500
team@fortemfin.com
Latest News
Switzerland says it's ready to make Trump 'more attractive offer' on trade
Switzerland is ready to make a "more attractive offer" in trade talks with Washington, its government said on Monday, following a crisis meeting aimed at averting a 39% U.S. import tariff on Swiss goods that threatens to hammer its export-driven economy.
Reuters
Read Story
Wall Street rebounds as Fed rate cut bets intensify on weaker payrolls
Wall Street's main indexes bounced back on Monday after a sharp pullback in the previous session, buoyed by growing expectations of deeper Federal Reserve interest rate cuts following an unexpectedly weak jobs report.
Reuters
Read Story
Brian Amidei, along with Partners Joseph Romano and Brett D'Orlando have also been named *2014, 2015, 2016, 2017, 2018 Five Star Wealth Managers!
Disclosures:
Awards and recognitions by unaffiliated rating services, companies, and/or publications should not be construed by a client or prospective client as a guarantee that he/she will experience a certain level of results if Fortem is engaged, or continues to be engaged, to provide investment advisory services; nor should they be construed as a current or past endorsement of Fortem or its representatives by any of its clients. Rankings published by magazines and others are generally based on information prepared and/or submitted by the recognized advisor. Awards may not be indicative of one client’s experience or of the Firm’s future performance. Neither Fortem nor the recognized advisor has paid a fee for inclusion on a list, nor purchased any additional material from the award provider. The criteria for each award is listed below:
Five Star Professional Disclosure:
The Five Star Wealth Manager award is based on 10 eligibility and evaluation criteria: 1) Credentialed as an investment advisory representative (IAR) or a registered investment advisor; 2) Actively employed as a credentialed professional in the financial services industry for a minimum of five years; 3) Favorable regulatory and complaint history review; 4) Fulfilled their firm review based on internal firm standards; 5) Accepting new clients; 6) One-year client retention rate; 7) Five-year client retention rate; 8) Non-institutionalized discretionary and/or non-discretionary client assets administered; 9) Number of client households served; and 10) Educational and professional designations. The inclusion of a wealth manager on the Five Star Wealth Manager list should not be construed as an endorsement of the wealth manager by Five Star Professional or the magazine. The award methodology does not evaluate the quality of services provided. Additional information about this award is available at: fivestarprofessional.com/2016FiveStarWealthManagerMethodology.pdf
Fortem Financial 2016. All rights reserved.
Data Sources: News items are based on reports from multiple commonly available international news sources (i.e. wire services) and are independently verified when necessary with secondary sources such as government agencies, corporate press releases, or trade organizations. Market Data: Based on reported data in WSJ Market Data Center (indexes); U.S. Treasury (Treasury Yields); U.S. Energy Information Administration/Bloomberg.com Market Data (oil spot price, WTI Cushing, OK); www.goldprice.org (spot gold/silver); Oanda/FX Street (currency exchange rates). All information is based on sources deemed reliable, but no warranty or guarantee is made as to its accuracy or completeness.
Neither the information nor any opinion expressed herein constitutes a solicitation for the purchase or sale of any securities, and should not be relied on as financial advice. The opinions expressed are solely those of the author, and do not represent those of Fortem Financial, LLC or any of its affiliates. Past performance is no guarantee of future results. All investing involves risk, including the potential loss of principal, and there can be no guarantee that any investing strategy will be successful. Forward looking statements are based on current expectations and assumptions, the economy, and future conditions. As such, forward-looking statements are subject to inherent uncertainty, risks, and changes in circumstance that are difficult to predict. Actual results may differ materially from the anticipated outcomes. Carefully consider investment objectives, risk factors and charges and expenses before investing. Fortem Financial is a registered investment adviser with the SEC. Advisory services are offered through Fortem Financial.
The Dow Jones Industrial Average (DJIA) is a price-weighted index composed of 30 widely traded blue-chip U.S. common stocks. The S&P 500 is a market-cap weighted index composed of the common stocks of 500 leading companies in leading industries of the U.S. economy. The NASDAQ Composite Index is a market-value weighted index of all common stocks listed on the NASDAQ stock exchange. The Russell 2000 is a market-cap weighed index composed of 2,000 U.S. small-cap common stocks. The Global Dow is an equally weighted index of 150 widely traded blue-chip common stocks worldwide. Market indices listed are unmanaged and are not available for direct investment.
Fortem Financial Author