2023 Has Been Full of Surprises but Fundamentals Should Prevail

I came across an interesting article that discusses the disjointed market we have seen thus far in 2023. We believe fundamentals will drive this market as we progress through the year and believe our portfolios are positioned to reduce volatility as we proceed forward. We are overweight good high dividend paying value stocks at this time which are trading at a discount to the overall market.


Mysterious Ways: Growth vs. Value Debate

by Liz Ann Sonders, Kevin Gordon of Charles Schwab, 5/3/23

Despite some rougher days recently, large-cap, growth-oriented sectors like Communication Services and Technology are still the best-performers this year—up 24.5% and 22%, respectively, through the end of April. Since both tend to get a disproportionate share of attention, and given they house the largest stocks in the S&P 500 (Apple, Microsoft, and Alphabet), it's worth looking at the "health" of both sectors.

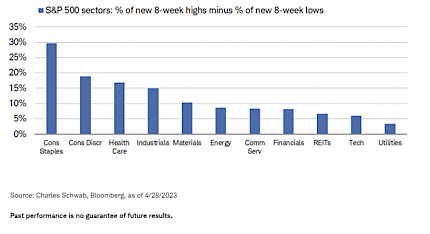
Unfortunately, it's not a clean bill. As shown in the chart below, Tech and Communication Services rank poorly when it comes to the percentage of their members reaching a new eight-week high relative to the percentage reaching a new eight-week low. Conversely, a traditional defensive sector, Consumer Staples has much healthier breadth among its members.

A Stronger Defensive Line

S&P 500 Sectors: % of New 8 Week Highs Minus Percent of New 8 Week Lows

While defensive plays have been strengthening—with Utilities and Consumer Staples up 1.8% and 3.4%, respectively, in April—mega-cap heavyweights are still hanging in there. Indeed, Communication Services finished up 3.6% in April, but here's the catch: excluding the two largest stocks in the index (Meta and Alphabet), the sector would have declined slightly.

That speaks to a broader issue that has plagued the market this year, which we highlighted in a previous report. The concentration in outperformance up the cap spectrum has been one of the growing risks for the market and hasn't abated. To be sure, some of the kneejerk reactions by investors in jumping into well-capitalized, large-cap names are justified; given still-looming stress in the banking sector and higher interest rate pressures for small companies. When the generals are on the front lines but the soldiers are lagging behind, battles are harder to win.

The (Equal Weight) Tech Wreck

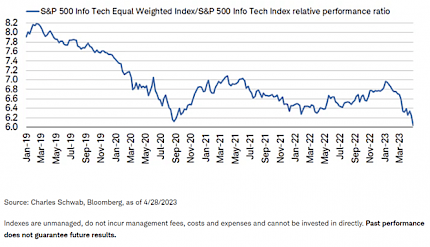
Homing in specifically on the ever-popular Tech sector, it represents the posterchild for the buildup in concentration risk this year. As shown in the chart below, the equal weighted version of the S&P 500 Information Technology sector has fallen to its lowest price relative to the cap weighted version in several years—undercutting the September 2020 low (which was the peak in relative performance for the "big 5" relative to the rest of the S&P 500).

All Else is Not Equal

S&P 500 Info Tech Equal Weighted Index / S&P 500 Info Tech Index Relative Performance Ratio

Prior instances of underperformance for the equal weight index—mid-to-late 2020 and late 2021—preceded reversals in the ratio, but it's worth noting certain differences. The reversal from late 2020 into early 2021 didn't precede anything sinister for the market, as the "average" stock was reclaiming its pandemic losses, courtesy of the broad reopening of the economy. As we all remember, 2021 wasn't a bad level for the market in general. Yet, the underperformance in late 2021 preceded a much different set of circumstances in 2022, a full-blown bear market that dealt a large hit to the large-cap behemoths.

One can't be certain as to which scenario today's declining ratio is predicting, but it's worth noting that—unlike in 2020—we are no longer relying on a few companies (i.e., the mega caps in Tech or Communication Services) to carry out our everyday lives. If participation down the cap spectrum doesn't show signs of strengthening, it would likely be suggestive of a worsening economic outlook, thus presenting a risk to stocks more broadly.

The Growth and Value Conundrum

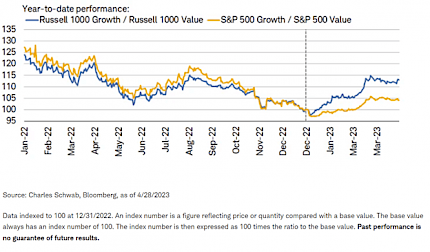
Another area in which leadership dynamics have become difficult to parse through is the growth and value universe. One might look at the aforementioned outperformance of large-cap "growth" sectors like Tech and Communication Services, and expect growth-labeled indexes to reflect similar strength. That simply isn't the case across all indexes, though. As shown below, the Russell 1000 Growth Index has outpaced the Russell 1000 Value Index by a solid margin this year (nearly 15%). Yet, S&P 500 Growth's gain relative to that of S&P 500 Value has been much weaker at 4%.

Russell is the Stronger Quarterback

Year to Date Performance Russell 1000 vs. S&P 500

As we wrote in early March, much of the divergence in performance can be attributed to the mid-December rebalance for the S&P indexes. Russell doesn't rebalance its indexes until June, so for now, there remain glaring differences in how the benchmarks are constructed. There are times, like last December, when rebalancing has dramatic results. On December 18, the day before S&P did its rebalancing, all eight of the "mega-cap 8" (Alphabet, Amazon, Apple, Meta, Microsoft, Netflix, NVIDIA and Tesla) were in the S&P Pure Growth Index. On December 19, following the rebalancing, only one of the eight (Apple) remained. On December 18, Tech represented more than 37% of the S&P Pure Growth Index; while on December 19, it had dropped to only 13%.

Also of note, the S&P Pure Growth index does not contain any stocks that overlap into their value indexes; while the S&P Pure Value index does not contain any stocks that overlap into their growth indexes. However, there are many stocks that coexist in the regular S&P Growth and Value indexes. In fact, of the seven stocks among the "mega-cap 8" that left the S&P Pure Growth index as of December 19, two of them (Amazon and Microsoft) now overlap in both the S&P Growth and S&P Value indexes.

A Quilt of a Different Style

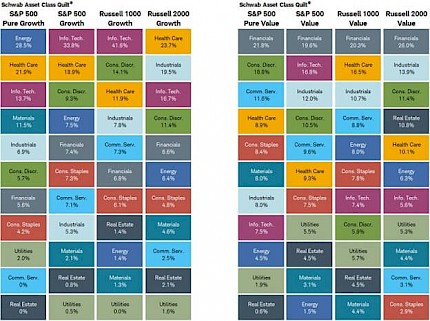
Shown below is a style index version of our quilt charts, which typically show performance among asset classes or sectors. This time, each percentage represents the weight of each sector in the index listed at the top. Given the recent focus on the Tech sector, take a look at its weightings in various indexes:

  • 13.7% in S&P 500 Pure Growth (third place)
  • 33.8% in S&P 500 Growth, a bit of a distance from 41.6% in Russell 1000 Growth
  • 16.8% in S&P 500 Value (second place)

It's Not What You Think

Sector Weights by Percentage - Russell 1000 vs. S&P 500

This speaks to the essence of the growth vs. value debate. We think there are three ways to think about growth and value:

  • There are the growth- and value-labeled indexes (and their at-times stark weighting differences, like today).
  • There are the pre-conceived notions of what are growth stocks and what are value stocks.
  • There are the actual factors (or characteristics) of growth and value.

Conventional wisdom might suggests that Tech should automatically be associated with growth—and that the stocks generally only live in growth indexes. However, that is clearly not the case in S&P 500 Pure Growth, which now has Energy as the heaviest weight, followed by Health Care; leaving Tech in third place. Conversely, a value-oriented investor wanting to shun Tech might look to S&P 500 Value as an obvious choice, but Tech is now the second largest sector in that index.

Not Your Parents' Growth and Value

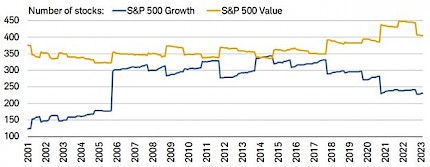
Another way to look at shifts in the growth and value landscape over time is to compare how many stocks are in the indexes with how many actually exhibit growth and value factors. As shown below, the number of stocks in the S&P 500 Growth index has steadily declined from a peak about a decade ago, but remains high relative to the inception of the index to two decades ago. Conversely, the number of stocks in the S&P 500 Value index, while off the peak, is still quite high relative to history.

Less Growth, More Value

S&P 500 Growth vs. S&P 500 Value

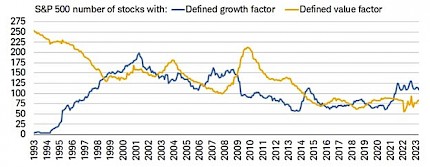
The story changes when screening for the number of stocks that have true characteristics of growth and value. This is by no means an exhaustive screen, as there are many ways to characterize and define each style, but for now we'll stick with simple definitions (shown in the footnote of the following chart) for each. Within the overall S&P 500 index, the number of stocks with a defined growth factor has remained unchanged for more than a decade; while the number of stocks with a defined value factor has declined more dramatically.

A Shrinking Pool of Growth and Value

S&P 500 Number of Stocks with Defined Growth Factor Vs. Defined Value Factor

Again, this emphasizes the importance of taking a factor-based approach when it comes to growth and value. There are times (like today) when huge differences in indexes and factors can lead to dramatically different performance dynamics.

In Sum

We find that growth vs. value debates are generally approached too simplistically; which can lead investors astray. We remain focused on factor-based analysis and screening; especially when it comes to looking for stocks that have actual growth characteristics and/or stocks that have actual value characteristics. We also suggest investors remove their blinders and be open-minded when it comes to screening for stocks across growth and value factors. It's particularly important in today's market environment; during which we continue to emphasize "quality." Almost by definition, high quality tends to manifest itself in a blend of growth and value factors; including positive earnings revisions/surprises, dividend growth, strong balance sheets, ample interest coverage, and lower volatility, among others.


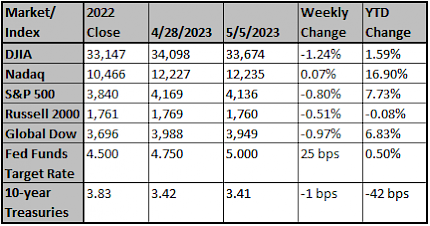
Market and Index Changes for the Week Ending 5/5/2023

Chart reflects price changes, not total return. Because it does not include dividends or splits, it should not be used to benchmark performance of specific investments. Data provided by Refinitiv.


Sincerely,

Fortem Financial
(760) 206-8500
team@fortemfin.com


Latest News


US Consumers' Inflation Expectations Mixed in April, NY Fed Report Shows

(Reuters) - U.S. consumers said last month they expected slightly lower inflation in a year's time, the New York Federal Reserve said in a report that also showed the bank stresses that kicked off in March weren't weighing heavily on the moods of Americans.

U.S. News

Read Story


Biden seeks debt ceiling talks, as U.S. faces possible June 1 default

President Biden invited House Speaker Kevin McCarthy (R-Calif.) and other congressional leaders to the White House next week to discuss the debt ceiling, as Washington scrambled Monday to respond to news that the government could default on its obligations as soon as June 1.

The Washington Post

Read Story


Oil prices inch up as recession fears begin to fade

SINGAPORE, May 8 (Reuters) - Oil prices rose slightly in early Asian trade on Monday as fears of a recession in the U.S., which drove prices down for three straight weeks for the first time since November, began to recede. Brent crude futures were up 6 cents at $75.36 a barrel at 0022 GMT.

Reuters

Read Story


Brian Amidei, along with Partners Joseph Romano and Brett D'Orlando have also been named *2014, 2015, 2016, 2017, 2018 Five Star Wealth Managers!

Disclosures:
Awards and recognitions by unaffiliated rating services, companies, and/or publications should not be construed by a client or prospective client as a guarantee that he/she will experience a certain level of results if Fortem is engaged, or continues to be engaged, to provide investment advisory services; nor should they be construed as a current or past endorsement of Fortem or its representatives by any of its clients. Rankings published by magazines and others are generally based on information prepared and/or submitted by the recognized advisor. Awards may not be indicative of one client’s experience or of the Firm’s future performance. Neither Fortem nor the recognized advisor has paid a fee for inclusion on a list, nor purchased any additional material from the award provider. The criteria for each award is listed below:

Five Star Professional Disclosure:
The Five Star Wealth Manager award is based on 10 eligibility and evaluation criteria: 1) Credentialed as an investment advisory representative (IAR) or a registered investment advisor; 2) Actively employed as a credentialed professional in the financial services industry for a minimum of five years; 3) Favorable regulatory and complaint history review; 4) Fulfilled their firm review based on internal firm standards; 5) Accepting new clients; 6) One-year client retention rate; 7) Five-year client retention rate; 8) Non-institutionalized discretionary and/or non-discretionary client assets administered; 9) Number of client households served; and 10) Educational and professional designations. The inclusion of a wealth manager on the Five Star Wealth Manager list should not be construed as an endorsement of the wealth manager by Five Star Professional or the magazine. The award methodology does not evaluate the quality of services provided. Additional information about this award is available at: fivestarprofessional.com/2016FiveStarWealthManagerMethodology.pdf
Fortem Financial 2016. All rights reserved.

Data Sources: News items are based on reports from multiple commonly available international news sources (i.e. wire services) and are independently verified when necessary with secondary sources such as government agencies, corporate press releases, or trade organizations. Market Data: Based on reported data in WSJ Market Data Center (indexes); U.S. Treasury (Treasury Yields); U.S. Energy Information Administration/Bloomberg.com Market Data (oil spot price, WTI Cushing, OK); www.goldprice.org (spot gold/silver); Oanda/FX Street (currency exchange rates). All information is based on sources deemed reliable, but no warranty or guarantee is made as to its accuracy or completeness.

Neither the information nor any opinion expressed herein constitutes a solicitation for the purchase or sale of any securities, and should not be relied on as financial advice. The opinions expressed are solely those of the author, and do not represent those of Fortem Financial, LLC or any of its affiliates. Past performance is no guarantee of future results. All investing involves risk, including the potential loss of principal, and there can be no guarantee that any investing strategy will be successful. Forward looking statements are based on current expectations and assumptions, the economy, and future conditions. As such, forward-looking statements are subject to inherent uncertainty, risks, and changes in circumstance that are difficult to predict. Actual results may differ materially from the anticipated outcomes. Carefully consider investment objectives, risk factors and charges and expenses before investing. Fortem Financial is a registered investment adviser with the SEC. Advisory services are offered through Fortem Financial.

The Dow Jones Industrial Average (DJIA) is a price-weighted index composed of 30 widely traded blue-chip U.S. common stocks. The S&P 500 is a market-cap weighted index composed of the common stocks of 500 leading companies in leading industries of the U.S. economy. The NASDAQ Composite Index is a market-value weighted index of all common stocks listed on the NASDAQ stock exchange. The Russell 2000 is a market-cap weighed index composed of 2,000 U.S. small-cap common stocks. The Global Dow is an equally weighted index of 150 widely traded blue-chip common stocks worldwide. Market indices listed are unmanaged and are not available for direct investment.

Fortem Financial

Recent Posts

PRIVACY NOTICE REGARDING CLIENT PRIVACY

Fortem Financial Group, LLC, has adopted this policy with recognition that protecting the privacy and security of the non-public personal information we obtain about our customers is an important responsibility.

All financial companies choose how they share your non-public personal information. Federal law gives consumers the right to limit some but not all sharing. Federal law also requires us to tell you how we collect, share, and protect your non-public personal information. Even when you are no longer our customer, we will only share your non-public personal information as described in this notice. So, please read this notice carefully to understand what we do.

The types of non-public personal information we collect and share depend on the product or service you have with us. This information can include items such as your Social Security number and income, your account balances and transaction history, and your investment experience and account transactions.

We collect your non-public personal information in a variety of ways. For example, we obtain your non-public personal information when you open an account or give us your income information, tell us about your portfolio or deposit money, or enter into an investment advisory contract. We also collect your non-public personal information from other companies. For example, from the custodians who hold your account assets.

All financial companies need to share customer’s non-public personal information to run their everyday business. Below, we describe the reasons we can share your non-public personal information and whether you can limit this sharing.

We share your non-public personal information for our everyday business purposes such as to process your transactions, maintain your account(s), respond to court orders and legal investigations, report to credit bureaus, to protect the confidentiality or security of your records, or as permitted by law. We may also share your non-public personal information for our own firm’s marketing purposes; so that we can offer our products and services to you.

Federal law gives you the right to limit only sharing non-public personal information about your credit worthiness for our affiliates’ everyday business purposes; sharing non-public personal information about you with our affiliates to market to you; and sharing non-public personal information with non-affiliates to market to you.

We don’t share non-public personal information about your creditworthiness with our affiliates for their everyday business purposes. We don’t share your non-public personal information with our affiliates to market to you. We don’t share your non-public personal information with non-affiliates to market to you. We also don’t share your non-public personal information for joint marketing with other financial companies. State laws and individual companies may give you additional rights to limit sharing.

We share non-public personal information with our parent company affiliate, Focus Financial Partners, Inc, for its internal and external auditing purposes. We also share your non-public personal information with a non-affiliate for the purpose of aggregating it and providing summary information based on this data to our parent company, Focus Financial Partners, Inc.

To protect your non-public personal information from unauthorized access and use, we use security measures that comply with federal law. These measures include computer safeguards and secured files and buildings.

Our policy about obtaining and disclosing non-public personal information may change from time to time. We will provide you notice of any material change to this policy before we implement the change.

If you have questions please call us at 760-206-8500 or go to our website at www.fortemfin.com.

IMPORTANT CONSUMER DISCLOSURE

Fortem Financial Group, LLC ("Fortem Financial" or the "Firm") is a federally registered investment adviser with offices in California and Arizona. Fortem Financial and its representatives are in compliance with the current registration and notice filing requirements imposed upon federally registered investment advisers by those states in which Fortem Financial maintains clients. Fortem Financial may only transact business in those states in which it is notice filed, or qualifies for an exemption or exclusion from notice filing requirements.

This website is limited to the dissemination of general information regarding the Firm's investment advisory services offered to U.S. residents residing in states where providing such information is not prohibited by applicable law. Accordingly, the publication of Fortem Financial' website on the Internet should not be construed by any consumer and/or prospective client as a solicitation to effect, or attempt to effect transactions in securities, or the rendering of personalized investment, tax or legal advice. Furthermore, the information resulting from the use of any tools or other information on this website should not be construed, in any manner whatsoever, as the receipt of, or a substitute for, personalized individual advice from Fortem Financial. Any subsequent direct communication from Fortem Financial with a prospective client will be conducted by a representative that is either registered or qualifies for an exemption or exclusion from registration in the state where the prospective client resides. Fortem Financial does not make any representations as to the accuracy, timeliness, suitability, completeness, or relevance of any information prepared by any unaffiliated third party, whether linked to this website or incorporated herein, and takes no responsibility therefore. All such information is provided for convenience purposes only and all users thereof should be guided accordingly.

All statements and opinions included on this website are subject to change as economic and market conditions dictate, and do not necessarily represent the views of Fortem Financial or any of their respective affiliates. Past performance may not be indicative of future results and there can be no assurance that any views, outlooks, projections or forward-looking statements will come to pass. Investing involves risk, including the potential loss of principal, and the profitability of any particular investment strategy or product cannot be guaranteed.

Any rating referenced herein may not be representative of any one client's experience. Further, the Firm's receipt of any rating is not indicative of the Firm's future performance. The Charles E. Merrill Circle of Excellence award is granted by Merrill Lynch for outstanding client service and satisfaction. The award is granted based on annual criteria established by Merrill Lynch for its top decile advisors. The Barron's Top 1,200 Financial Advisors rating of the top financial advisors in the United States is based on data provided by participating firms. The following factors are included in the rankings: assets under management, revenue produced for the firm, regulatory record, quality of practice and philanthropic work. Investment performance is not an explicit component. The Palm Springs Life's "40 Under 40" Rising Young Professionals to Watch in the Coachella Valley is based upon nominations from the local business community and selected by the staff of Palm Springs Life.

For information pertaining to the registration status of Fortem Financial, please refer to the Investment Adviser Public Disclosure website, operated by the U.S. Securities and Exchange Commission, at www.adviserinfo.sec.gov., which contains the most recent versions of the Firm's Form ADV disclosure documents.

ACCESS TO THIS WEBSITE IS PROVIDED FOR INFORMATIONAL PURPOSES ONLY AND WITHOUT ANY WARRANTIES, EXPRESSED OR IMPLIED, REGARDING THE ACCURACY, COMPLETENESS, TIMELINESS, OR RESULTS OBTAINED FROM ANY INFORMATION POSTED ON THIS WEBSITE OR ANY THIRD PARTY WEBSITE REFERENCED HEREIN.