Monthly Market Commentary for April

Looking back on the last four months, to many of us it feels like the stock and bond markets have been run through the ringer. However, it really hasn’t been nearly as bad as it feels. We have certainly seen some big intra-day moves, but they have been both positive and negative. As of April 30th, the Dow Jones Industrial Average is down 1.6%, the S&P is down 0.4%, and the Nasdaq composite is up 2.7% for the year. In the bond market, the Barclay’s Aggregate Bond Index is down 2.4%, the S&P Preferred Stock Index is down 1.1%, and the S&P US Mortgage Backed Securities Adjustable Rate index is up 0.1% for the year. While none of this is great news, it’s also not horrible news. So why does it feel so bad?

We believe part of the explanation is the stock and bond markets have been making big, dramatic moves and the media has been sensationalizing it. On March 30th, MarketWatch published an article with the title, “What struggled in the first quarter? Stocks, bonds, basically everything.” For the opening line of the article, they borrowed a dramatic line from Charles Dickens, “It was the best of times, it was the worst of times.” On Feb 21st, CNBC reported “Rising bond yields stomp out stock rally after Fed report confuses market.” On February 11th, CNN reported “Why the bond market is freaking out Wall Street,” and on February 5th, they reported “Dow plunges 1,175 – worst point decline in history.” The constant barrage of sensational negative headlines make it harder to focus on the fact that markets have remained essentially flat for the first four months of 2018 after a fantastic 2017.

Interestingly, the media seems to have a much harder time sharing positive news. A look at earnings shows the S&P 500’s earnings growth is on track to reach +24%. 1 Sales growth looks like it’s on track to reach over 8%. 2So where is the media in reporting this important information? Trying to find examples of the media reporting this positive data has proven much harder for us than finding examples of their negative biased reporting. As an example, on April 27th the New York Times published an article titled, “U.S. Economy Grew by 2.3% in First Quarter, Easing Slightly.” The first line of the article was, “The figure falls short of President Trump’s goal of at least 3%.” They failed to mention it was 0.3% higher than expectations, and they they failed to note that since 2010, First Quarter GDP has been running significantly lower than the total annual GDP. Specifically, the Average Second Quarter GDP since 2010 has been 2.05 times greater than the average First Quarter GDP. We’ve found a similar relationship in the Third and Fourth Quarter GDP data too. Again, going back to 2010, the Average Third Quarter GDP has been 1.85 times First Quarter GDP and the Average Fourth Quarter GDP has been 1.69 times the Average First Quarter GDP. We will not know if the relationship between First Quarter, Second Quarter, Third Quarter, and Fourth Quarter GDP will remain consistent until the end of the year, but if we were to forecast 2018 GDP based upon this relationship, it would predict 2018 GDP would be equal to 3.8%. To be clear, we are not predicting 2018 GDP growth will be 3.8%, we are simply stating that the media seems to be very adept at sharing partial data and sensationalizing their message.

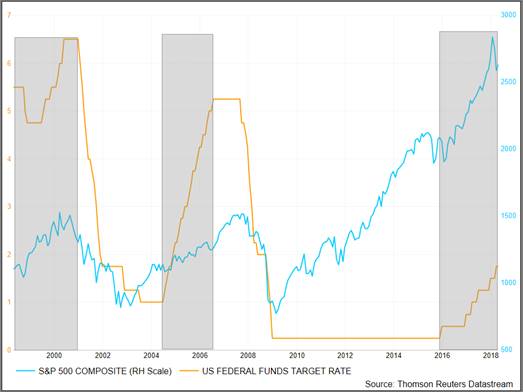
Further, we question the logic used by many of the market pundits. Over the last month we’ve repeatedly heard in the media that the rise in interest rates is causing the market to sell off. We’re not quite sure where they are getting their information from, but it seems to lack historical context. Below, we’ve included two charts covering the last 20 years. In the first chart (S&P 500 vs. 10-yr Treasury yield), the PURPLE line is the rate on the 10-year Treasury, and the BLUE line is the S&P 500. We’ve highlighted in GREY the periods where the rate was climbing, and as you can see, the typical stock market reaction to rising rates is to go UP. In the second chart we show the S&P 500 in relation to the Fed Funds Rate. The ORANGE line is the Fed Funds Rate and the BLUE line is the S&P 500. Again, you see the relation is that when the Fed is raising rates, the market usually goes UP.

Chart 1: S&P 500 and 10 yr-Treasury yield

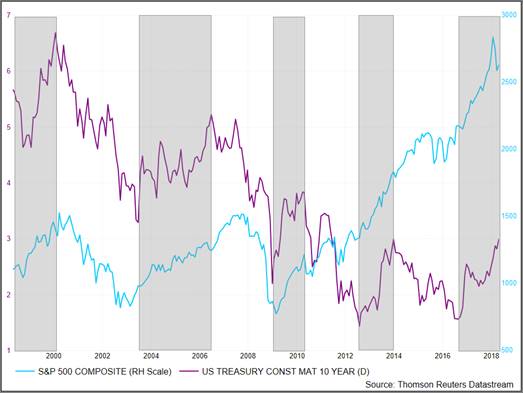
Chart 2: S&P 500 and Fed Funds Rate

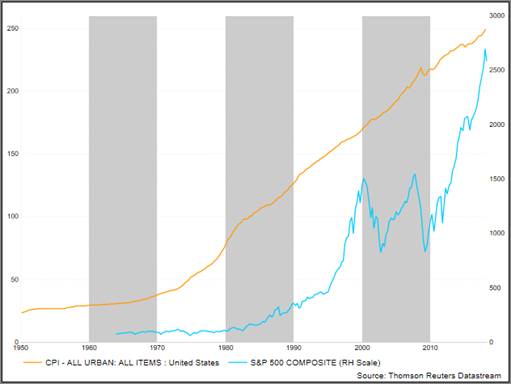
We’ve heard similar arguments with respect to inflation, and find them to be equally unfounded. The typical argument we hear is that with the cost of materials and wages up, profitability will go down, and therefore the stock market will go down. In the chart below, we’ve shown the S&P 500 (BLUE) in relation to inflation (ORANGE), and it’s clear that inflation has been much more stable than the market has been. Further, when inflation goes up, the S&P 500 goes up (for those who like statistics, the correlation between inflation and the S&P 500 is >0.9, which is a very high positive correlation). The incorrect assumption market commentators are making is that the sale price of finished goods and services cannot go up and will not go up despite increases in the cost of the inputs (labor and raw materials…).

Chart 3: Inflation vs. S&P 500

The question they (and investors) should ask themselves is, “can the price of finished goods and services continue to increase?” The answer to this question depends on personal income. Why? Because while none of us like to pay more for things, we’ve all made a regular habit of it, and our income determines if we can. According to US Census data, in 1980 the median sale price of homes was $64,600. By 1990, it had increased to $122,900. In 2000, the median price was $169,000, and in 2010 the median was $221,800. How could Americans afford to buy homes with all these increases? Because with a 1.9 times increase in home prices from 1980 to 1990 Americans realized a 2.2 times increase in personal income. Between 1990 and 2000 the median home price increased by 1.4 times and wages increased by 1.8 times. From 2000 to 2010, the median home price increased by 1.3 times with a 1.5 times increase in personal income.

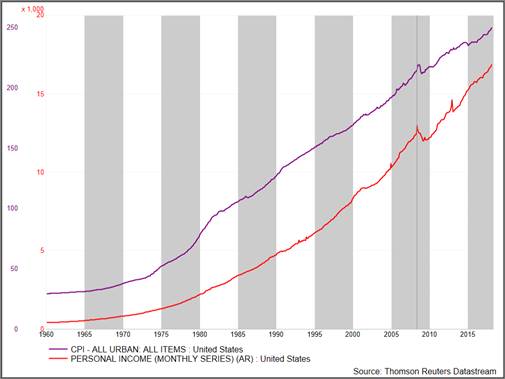
Perhaps those who claim current inflation will cause the economy to stall believe things will be different this time despite the data indicating otherwise. The chart below shows inflation (PURPLE) and personal income (RED). You can see that since 2012, wage growth has outpace inflation, suggesting to us that the price of finished goods and services can and will continue to climb, allowing the value of the stock market to continue to climb.

Chart 4: Inflation vs. Personal Income

As the data continues to unfold, we will share the changes with you and we will look at adjusting our position in the markets accordingly. For the present, we believe the economic data and the corporate earnings data suggest stocks should outperform bonds again this year. We also believe it suggests investors may want to consider adding to positions on weakness.

Click here to request more information. 


Categories: Monthly Market Commentary

Brian Amidei, along with Partners Joseph Romano and Brett D'Orlando have also been named *2014, 2015, 2016, 2017, 2018 Five Star Wealth Managers!

Disclosures:
Awards and recognitions by unaffiliated rating services, companies, and/or publications should not be construed by a client or prospective client as a guarantee that he/she will experience a certain level of results if Fortem is engaged, or continues to be engaged, to provide investment advisory services; nor should they be construed as a current or past endorsement of Fortem or its representatives by any of its clients. Rankings published by magazines and others are generally based on information prepared and/or submitted by the recognized advisor. Awards may not be indicative of one client’s experience or of the Firm’s future performance. Neither Fortem nor the recognized advisor has paid a fee for inclusion on a list, nor purchased any additional material from the award provider. The criteria for each award is listed below:

Five Star Professional Disclosure:
The Five Star Wealth Manager award is based on 10 eligibility and evaluation criteria: 1) Credentialed as an investment advisory representative (IAR) or a registered investment advisor; 2) Actively employed as a credentialed professional in the financial services industry for a minimum of five years; 3) Favorable regulatory and complaint history review; 4) Fulfilled their firm review based on internal firm standards; 5) Accepting new clients; 6) One-year client retention rate; 7) Five-year client retention rate; 8) Non-institutionalized discretionary and/or non-discretionary client assets administered; 9) Number of client households served; and 10) Educational and professional designations. The inclusion of a wealth manager on the Five Star Wealth Manager list should not be construed as an endorsement of the wealth manager by Five Star Professional or the magazine. The award methodology does not evaluate the quality of services provided. Additional information about this award is available at: fivestarprofessional.com/2016FiveStarWealthManagerMethodology.pdf
Fortem Financial 2016. All rights reserved.

Data Sources: News items are based on reports from multiple commonly available international news sources (i.e. wire services) and are independently verified when necessary with secondary sources such as government agencies, corporate press releases, or trade organizations. Market Data: Based on reported data in WSJ Market Data Center (indexes); U.S. Treasury (Treasury Yields); U.S. Energy Information Administration/Bloomberg.com Market Data (oil spot price, WTI Cushing, OK); www.goldprice.org (spot gold/silver); Oanda/FX Street (currency exchange rates). All information is based on sources deemed reliable, but no warranty or guarantee is made as to its accuracy or completeness.

Neither the information nor any opinion expressed herein constitutes a solicitation for the purchase or sale of any securities, and should not be relied on as financial advice. The opinions expressed are solely those of the author, and do not represent those of Fortem Financial, LLC or any of its affiliates. Past performance is no guarantee of future results. All investing involves risk, including the potential loss of principal, and there can be no guarantee that any investing strategy will be successful. Forward looking statements are based on current expectations and assumptions, the economy, and future conditions. As such, forward-looking statements are subject to inherent uncertainty, risks, and changes in circumstance that are difficult to predict. Actual results may differ materially from the anticipated outcomes. Carefully consider investment objectives, risk factors and charges and expenses before investing. Fortem Financial is a registered investment adviser with the SEC. Advisory services are offered through Fortem Financial.

The Dow Jones Industrial Average (DJIA) is a price-weighted index composed of 30 widely traded blue-chip U.S. common stocks. The S&P 500 is a market-cap weighted index composed of the common stocks of 500 leading companies in leading industries of the U.S. economy. The NASDAQ Composite Index is a market-value weighted index of all common stocks listed on the NASDAQ stock exchange. The Russell 2000 is a market-cap weighed index composed of 2,000 U.S. small-cap common stocks. The Global Dow is an equally weighted index of 150 widely traded blue-chip common stocks worldwide. Market indices listed are unmanaged and are not available for direct investment.

Fortem Financial

Recent Posts

PRIVACY NOTICE REGARDING CLIENT PRIVACY

Fortem Financial Group, LLC, has adopted this policy with recognition that protecting the privacy and security of the non-public personal information we obtain about our customers is an important responsibility.

All financial companies choose how they share your non-public personal information. Federal law gives consumers the right to limit some but not all sharing. Federal law also requires us to tell you how we collect, share, and protect your non-public personal information. Even when you are no longer our customer, we will only share your non-public personal information as described in this notice. So, please read this notice carefully to understand what we do.

The types of non-public personal information we collect and share depend on the product or service you have with us. This information can include items such as your Social Security number and income, your account balances and transaction history, and your investment experience and account transactions.

We collect your non-public personal information in a variety of ways. For example, we obtain your non-public personal information when you open an account or give us your income information, tell us about your portfolio or deposit money, or enter into an investment advisory contract. We also collect your non-public personal information from other companies. For example, from the custodians who hold your account assets.

All financial companies need to share customer’s non-public personal information to run their everyday business. Below, we describe the reasons we can share your non-public personal information and whether you can limit this sharing.

We share your non-public personal information for our everyday business purposes such as to process your transactions, maintain your account(s), respond to court orders and legal investigations, report to credit bureaus, to protect the confidentiality or security of your records, or as permitted by law. We may also share your non-public personal information for our own firm’s marketing purposes; so that we can offer our products and services to you.

Federal law gives you the right to limit only sharing non-public personal information about your credit worthiness for our affiliates’ everyday business purposes; sharing non-public personal information about you with our affiliates to market to you; and sharing non-public personal information with non-affiliates to market to you.

We don’t share non-public personal information about your creditworthiness with our affiliates for their everyday business purposes. We don’t share your non-public personal information with our affiliates to market to you. We don’t share your non-public personal information with non-affiliates to market to you. We also don’t share your non-public personal information for joint marketing with other financial companies. State laws and individual companies may give you additional rights to limit sharing.

We share non-public personal information with our parent company affiliate, Focus Financial Partners, Inc, for its internal and external auditing purposes. We also share your non-public personal information with a non-affiliate for the purpose of aggregating it and providing summary information based on this data to our parent company, Focus Financial Partners, Inc.

To protect your non-public personal information from unauthorized access and use, we use security measures that comply with federal law. These measures include computer safeguards and secured files and buildings.

Our policy about obtaining and disclosing non-public personal information may change from time to time. We will provide you notice of any material change to this policy before we implement the change.

If you have questions please call us at 760-206-8500 or go to our website at www.fortemfin.com.

IMPORTANT CONSUMER DISCLOSURE

Fortem Financial Group, LLC ("Fortem Financial" or the "Firm") is a federally registered investment adviser with offices in California and Arizona. Fortem Financial and its representatives are in compliance with the current registration and notice filing requirements imposed upon federally registered investment advisers by those states in which Fortem Financial maintains clients. Fortem Financial may only transact business in those states in which it is notice filed, or qualifies for an exemption or exclusion from notice filing requirements.

This website is limited to the dissemination of general information regarding the Firm's investment advisory services offered to U.S. residents residing in states where providing such information is not prohibited by applicable law. Accordingly, the publication of Fortem Financial' website on the Internet should not be construed by any consumer and/or prospective client as a solicitation to effect, or attempt to effect transactions in securities, or the rendering of personalized investment, tax or legal advice. Furthermore, the information resulting from the use of any tools or other information on this website should not be construed, in any manner whatsoever, as the receipt of, or a substitute for, personalized individual advice from Fortem Financial. Any subsequent direct communication from Fortem Financial with a prospective client will be conducted by a representative that is either registered or qualifies for an exemption or exclusion from registration in the state where the prospective client resides. Fortem Financial does not make any representations as to the accuracy, timeliness, suitability, completeness, or relevance of any information prepared by any unaffiliated third party, whether linked to this website or incorporated herein, and takes no responsibility therefore. All such information is provided for convenience purposes only and all users thereof should be guided accordingly.

All statements and opinions included on this website are subject to change as economic and market conditions dictate, and do not necessarily represent the views of Fortem Financial or any of their respective affiliates. Past performance may not be indicative of future results and there can be no assurance that any views, outlooks, projections or forward-looking statements will come to pass. Investing involves risk, including the potential loss of principal, and the profitability of any particular investment strategy or product cannot be guaranteed.

Any rating referenced herein may not be representative of any one client's experience. Further, the Firm's receipt of any rating is not indicative of the Firm's future performance. The Charles E. Merrill Circle of Excellence award is granted by Merrill Lynch for outstanding client service and satisfaction. The award is granted based on annual criteria established by Merrill Lynch for its top decile advisors. The Barron's Top 1,200 Financial Advisors rating of the top financial advisors in the United States is based on data provided by participating firms. The following factors are included in the rankings: assets under management, revenue produced for the firm, regulatory record, quality of practice and philanthropic work. Investment performance is not an explicit component. The Palm Springs Life's "40 Under 40" Rising Young Professionals to Watch in the Coachella Valley is based upon nominations from the local business community and selected by the staff of Palm Springs Life.

For information pertaining to the registration status of Fortem Financial, please refer to the Investment Adviser Public Disclosure website, operated by the U.S. Securities and Exchange Commission, at www.adviserinfo.sec.gov., which contains the most recent versions of the Firm's Form ADV disclosure documents.

ACCESS TO THIS WEBSITE IS PROVIDED FOR INFORMATIONAL PURPOSES ONLY AND WITHOUT ANY WARRANTIES, EXPRESSED OR IMPLIED, REGARDING THE ACCURACY, COMPLETENESS, TIMELINESS, OR RESULTS OBTAINED FROM ANY INFORMATION POSTED ON THIS WEBSITE OR ANY THIRD PARTY WEBSITE REFERENCED HEREIN.