
After the AI Selloff: What the Filings Actually Show
On Friday, October 30, technology stocks had their worst day since June. The Nasdaq Composite fell 2.9% and closed 7.8% below its October 6 record. The Nasdaq-100 fell 3.5% and briefly crossed into correction territory, and the S&P 500 fell 1.8%. Intel lost nearly 29% after a weak outlook, AMD fell nearly 11%, and Nvidia fell 4%. For the Nasdaq Composite, October was the worst month since March 2025.
A decline measured only from the last peak tells half the story. Friday’s drop followed a strong run. From its 2026 low on March 30, at the height of the selloff over the Iran war, the S&P 500 rose 23.3% to a record close on October 6, and the Nasdaq Composite rose 32.7%. Even after October’s decline, the S&P 500 is 3.1% below that record and still 19.5% above its March low; the Nasdaq is 7.8% below its record and 22.3% above its March low. Measured in index points, the S&P 500 has given back about one-sixth of its spring-to-fall gain, and the Nasdaq about one-third.
Friday was the second sharp wave of AI-related selling since summer. In July, the Philadelphia Semiconductor Index fell into a bear market, more than 20% below its June high, and on July 28 the Nasdaq-100 dipped into correction territory before recovering to new highs in early October. Both the S&P 500 and the Nasdaq Composite remain above their late-July lows. In July the selling centered on chipmakers. This month it has spread to the companies paying for the build-out, and to how they pay for it: some of these companies are now spending more cash than their operations bring in, and some are borrowing to close the gap.
Those are fair concerns. We think the right way to answer them is to read what the companies have filed with the Securities and Exchange Commission, not what is said about them. Over the past month we worked through the latest quarterly filings from Microsoft, Alphabet, Amazon, Meta, Oracle, Nvidia and CoreWeave, including the third-quarter reports released in the last two weeks of October. Below is what the numbers show: what last week’s reports actually said, where the spending is going, who is paying for it, whether the profits are keeping up, and how much debt is really involved.
1 . What Last Week’s Reports Showed: Strong Demand, Heavy Cash Needs
The reports that set off the selling were not reports of weak demand. They were reports of strong demand that requires a great deal of cash up front.
- Amazon. Amazon Web Services revenue grew 39% to $46.0 billion, and Amazon’s operating income rose 61%. But revenue and earnings per share came in slightly below estimates, third-quarter capital spending ran well above what analysts expected, and the company said spending will rise again in 2027.
- Alphabet. Google Cloud revenue grew 103%, more than doubling. Operating income rose 30%. Earnings per share fell short of estimates, mostly because of an $8.7 billion paper loss on Alphabet’s equity stakes, chiefly SpaceX, rather than its operations. Free cash flow was negative $9.1 billion for the quarter, and the shares fell about 10% after hours.
- Microsoft. Azure grew 48% and the shares rose. Microsoft also trimmed its 2026 capital spending outlook to $170 billion from $175 billion. The reason was supply, not demand: outside providers delayed capacity into the first half of 2027, and management said customer demand still exceeds available supply.
- Meta. A week earlier, Meta’s revenue beat estimates, but reported profit, which included a one-time $9.9 billion legal charge, fell short, and the company spent about $2 billion more cash than it produced in the quarter. Its shares fell 7.9% the next day.
The pattern is consistent. Demand, revenue growth and operating profit were strong. What unsettled investors was cash: more money going out the door now, for revenue that arrives over years. That is a question of timing and financing, which the next section separates from the accounting noise around it.
2 . Separate the Business From the Investment Portfolio
This year, headline earnings at the largest technology companies have been distorted by something that has nothing to do with selling cloud services or advertising: changes in the value of stakes they hold in private AI developers and other companies. In the second quarter, Alphabet booked a $99.0 billion gain on its equity holdings, and Amazon booked $53.4 billion of non-operating income, mainly from its investment in Anthropic. In the third quarter the marks reversed at Alphabet, which recorded an $8.7 billion loss, and that loss, not its operations, explains most of its earnings shortfall.
These gains and losses are real accounting entries, but they are not cash, and they do not pay for data centers. Several of the stakes are in AI developers that are also large cloud customers, one more reason to keep them apart from operating results. To judge whether the build-out is affordable, two numbers matter: operating profit, which shows how the core business is doing, and operating cash flow, which is the money that actually funds the spending.

Read this way, the picture is clearer than the headlines. Operating profit grew at every company, by 11% to 61%. Together, the four generated about $176 billion of operating cash in the quarter against about $202 billion of capital spending, covering roughly 87% of it. Microsoft funded all of its spending from operations, with $18.6 billion left over. Meta and Alphabet covered most of theirs. Amazon, the largest spender, covered a little over half in the quarter and about 80% over the past 12 months, when operating cash flow rose 29% to $168.3 billion. The gap is being filled with borrowing and, at Alphabet and Meta, new shares.
That is the fair version of the concern behind Friday’s selloff. In our view, the businesses are not weakening; their spending is running ahead of the cash they generate, for now. Whether that is a problem depends on the questions the rest of this commentary takes up: whether the demand is real, whether profits keep pace with the new costs, and how much debt is involved.
3 . The Spending Is Enormous — and Its Growth Rate Is Slowing
Microsoft, Alphabet, Amazon and Meta spent about $408 billion on buildings, servers and chips in 2025, up 74% from the year before. Their 2026 guidance adds up to roughly $730 billion, another 79% increase. The analyst consensus compiled by LSEG I/B/E/S calls for about $1.01 trillion in 2027, and Alphabet and Amazon have both said 2027 spending will rise significantly.
That would still be a record, but growth would slow to about 39%, roughly half the pace of 2025 and 2026, and the dollars added would shrink from about $322 billion in 2026 to about $283 billion. Spending is still rising; the pace is slowing. That matters, because a slower pace gives revenue and cash flow room to catch up.
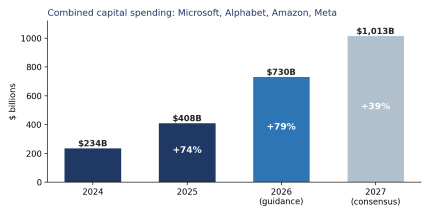
Combined capital expenditures, $ billions | Sources: company 10-K and 10-Q filings (2024–2025); company guidance as of October 2026 (2026); LSEG I/B/E/S consensus as of October 30, 2026 (2027). Microsoft uses fiscal-year cash spending for 2024–2025, calendar-year guidance including finance leases for 2026, and the average of its fiscal 2027 and 2028 consensus for 2027.
4 . The Demand Is Signed, Not Hoped For
The most common worry is that companies are building ahead of demand that may never arrive. The filings show something different. Each cloud provider reports the value of signed customer contracts it has not yet delivered — its backlog.

Revenue is growing fastest exactly where the money is being spent. The caveat is timing: much of this backlog is long-dated. About 30% of Microsoft’s and about 13% of Oracle’s is scheduled to turn into revenue within the next 12 months, and Amazon’s contracts run about six years on average. Long contracts provide visibility, but they also mean the payback arrives over years, not quarters.
5 . Computing Power Is Scarce, and Prices Show It
In a market where supply cannot keep up with demand, prices rise. That is what is happening to AI computing capacity.
- List prices are going up. Nebius, a specialist cloud provider, raised its published price for an Nvidia H100 chip from $3.85 to $4.50 an hour on October 1, 2026, its second increase in three months. Silicon Data’s H100 rental index rose from $2.00 an hour in December 2025 to $2.90 in late October 2026.
- Providers say so on the record. CoreWeave’s chief executive told investors in August that pricing for Nvidia’s newest chips is “setting new highs,” and that pricing for older chips is at or above where it was years ago.
- AI is lifting pricing inside the businesses, too. Meta’s average price per ad rose 14% last quarter on 10% more ads shown — revenue growth driven by price, not just volume (Meta 10-Q).
Chips that are three years old are renting for more today than a year ago. A frequent criticism of this cycle is that servers lose their value within two or three years, so the companies’ six-year depreciation schedules overstate profits. Rising rents on older chips point the other way.
6 . Profits Are Keeping Pace With the Spending
New data centers create a new expense: depreciation, the annual cost of wearing out the equipment. A simple test is whether the extra operating profit each company earned over the past year exceeds the extra depreciation it took on. For every company we reviewed, it does.

Meta’s ratio is the lowest because it is building ahead of its revenue, but its revenue still grew 26% last quarter.
7 . The Debt Is Real — and Small Next to the Businesses
Several of these companies have borrowed heavily this year, and the dollar amounts make headlines. The more useful question is how large the debt is relative to the business carrying it.

Total debt divided by operating cash flow over the most recent 12 months (Nvidia and CoreWeave annualized from the first half of 2026); leases excluded | Sources: company 10-Q filings; Fortem calculation.

For the four largest cloud and platform companies and Nvidia, debt equals between a few months and about one year of operating cash flow and less than 7% of market value. Microsoft, Alphabet, Meta and Nvidia each hold more cash and investments than debt. Where leverage is meaningful, it is concentrated in a few names: Oracle, whose debt equals about 2.7 years of cash flow, and the specialist provider CoreWeave, which is not yet profitable at the operating level.
Borrowing is rising quickly from a low base — Alphabet’s long-term debt reached $125 billion at September 30 — and S&P Global Ratings placed Meta’s AA- rating on negative outlook on October 30. Even so, Microsoft is rated AAA, Alphabet AA+ and Amazon AA by S&P, and outside Oracle the bond market has priced the four largest companies’ debt at or below the average for AA-rated corporate bonds.
8 . Why This Differs From 2000
The comparison everyone reaches for is the 1999–2001 telecom and internet build-out. The spending intensity is similar: several of today’s companies are spending as much as, or more than, the cash their operations generate, as the telecom carriers did then. Almost everything else is the opposite.

In 2000, too much capacity chased too little demand, and prices collapsed. Today, demand is running ahead of supply, and prices are rising. Supply and demand drive prices, and the price signal today is the opposite of the one that preceded the telecom bust.
9 . Valuations Are Well Below 2000 Levels
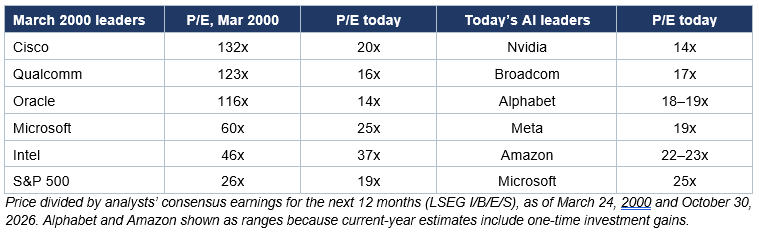
Based on analysts’ estimates of earnings over the next 12 months, the S&P 500 trades at about 19 times earnings, compared with about 26 times at the March 2000 peak on the same measure. The contrast is sharper for the technology leaders of each era.
10 . What We Are Watching
- Backlog turning into revenue. Contracts must convert into sales on schedule.
- Profit versus depreciation. Added profit should keep exceeding added depreciation as more data centers come online.
- Customer concentration. A handful of AI developers account for a large share of some backlogs; one, OpenAI, was 10.8% of Microsoft’s revenue last quarter.
- The leveraged edge of the market. Oracle’s and CoreWeave’s financing is where stress would show first.
- Free cash flow and credit markets. How quickly operating cash flow catches up with spending, and whether lenders keep financing the leveraged providers on reasonable terms. Credit spreads are one of the three conditions our monthly commentary lists as signals that would change our view.
- Computing prices. Whether rental rates hold as more new chips are delivered.
Our View
Friday’s selloff repriced the timing of the payoff. It did not change what the filings show: operating profit is rising at every one of the four largest spenders, and the investment gains and losses that swing their headline earnings do not fund the build-out. The real question is cash timing, and that is what we are watching.
The AI build-out is large, and some of it is now financed with debt. But the businesses doing most of the spending generate enormous cash, carry little debt relative to their size, and hold signed contracts for the capacity they are building. Computing capacity is priced like a scarce resource, profits are rising faster than the costs of the build, and the growth rate of spending is expected to slow next year. On the weight of the evidence, we see a well-funded investment cycle rather than a bubble. The risks are real and specific — long-dated contracts, concentrated customers, negative free cash flow at some of the largest spenders, and a few leveraged providers — and we will tell you if the data change.
This is the second time since July that the Nasdaq-100 has touched correction territory. Sharp declines in market leaders are uncomfortable, and they are part of owning the companies at the center of a major investment cycle. Our November monthly commentary, arriving next week, places this in the context of the broader economy: inflation, the Federal Reserve, and oil.
Key Dates to Watch
November 10: CoreWeave third-quarter results.
November 17: Nvidia third-quarter fiscal 2027 results.
Mid-December: Oracle second-quarter fiscal 2027 results (date not yet announced).

Chart reflects price changes, not total return. Because it does not include dividends or splits, it should not be used to benchmark performance of specific investments. Data provided by Refinitiv.
Sincerely,
Fortem Financial
(760) 206-8500
team@fortemfin.com
Latest News
Marvell doubles down on AI boom with costly $115 billion Lumentum deal
Marvell Technology is buying optical components maker Lumentum in a $115 billion all-stock deal, including debt, one of the tech industry's largest takeovers and a bold bet that the AI build-out will fuel chip demand for years.
Reuters
Oil drops 7% as Iran signals openness to peace talks
Oil prices fell more than 7% on Monday as talks between Iranian and Qatari officials lifted hopes for an end to the US-Israeli war with Iran and stabilization of Middle East crude supply.
Reuters
